This has taken a while as it first required finding/setting the appropriate permissions (properly!) across all 27 AWS accounts I’m currently looking after and finding a collection method that was:
a) not massively resource-intensive
b) worked for multiple accounts.
The first one was this, itself based on two other projects. It did take quite a lot of setting up and does technically work as it discovered all the available metrics. However, once you start adding metrics, it starts spawning a python process for each check, which quickly had the dual-core Zabbix appliance reaching a load of 25+, so we couldn’t have that. It also required the AWS roles/credentials setting in two files, along with the standard CLI client ones (so 3 places then), so that was a bit sprawling and lazy…
The second one was this official prometheus java applet which worked once I found an older build of the jar file “on the Internet”, but then it was discovered it only works for a single account/region per instance. Which would have meant running approximately 108 java instances somewhere. So not really practical.
So then, in finding out those limitations (and the posting of a former colleague to the Prometheus-users google group) I found the YACE project which is awesome because it can measure all of the things, everywhere. Using a compiled binary written in Go that uses about 120Mb and spits out all the metrics in Prometheus format in <1s. Making it ideal for running on a machine with restricted resources. 😉
This project actually uses properly the sts:assumerole functionality in AWS IAM across the 27 AWS accounts, but explaining how that works is another story…
The running-config example is here and is pretty much self-explanatory. This lives on the Zabbix server itself in ~/yace
So basically, this grabs all the required cloudwatch metrics for all defined accounts/regions and makes them available on the Zabbix host at http://localhost:5000/metrics in Prometheus format that can then be read by Zabbix itself.
For getting those metrics into Zabbix, I followed the instructions here on setting up and configuring discovery of the available metrics and creating items/triggers/graphs as appropriate.
Basically, anything that isn’t the initial HTTP get (every minute) is a ‘dependant item’ and converted to JSON for further processing.
The only real tricky part of this was working out the ‘jsonpath’ strings for the various parameters that could then be added as macros, like the ARN’s which are used to identify each item as that is the only consistent parameter (and also shows the account number and region which aren’t always available separately).
Using the RDS discovery rule as an example
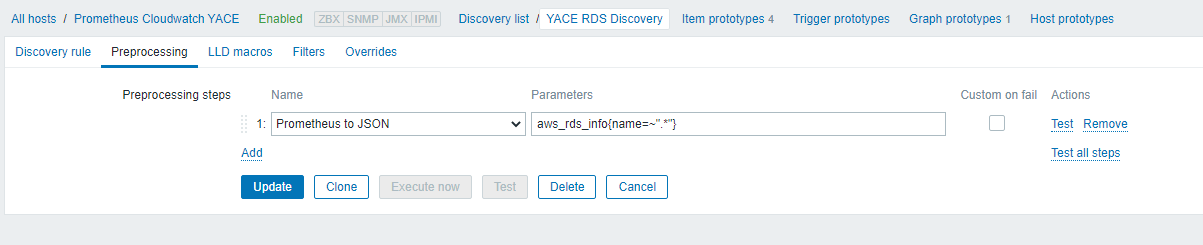
Under the Preprocessing tab, we have
“Prometheus to JSON” as aws_rds_info{name=~”.*”} which will match a line like this:
If we then take that line, click on the link for ‘test’, put that string in the ‘value’ box and click the ‘Test’ button, that will return a long json-formatted string.
This we can format with jq which will tell us what we need to know to create the appropriate jsonpath entries for the macro creation
So as you can see, all the tags are under the ‘labels’ path.
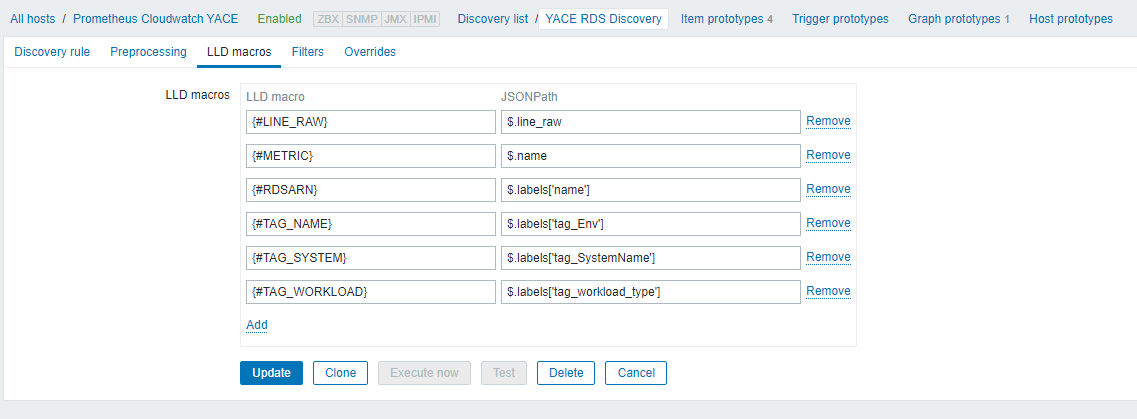
If you click the “LLD Macros” tab in the Zabbix GUI, you can see how the macros are created. For example:
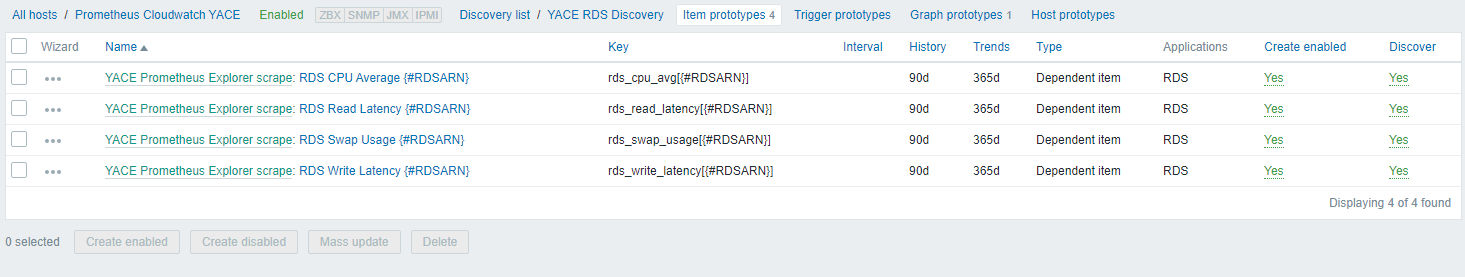
Which are then used in the ‘item prototype’ creation.
 So for a different example (because the availability zones are a bit tricky), the ELB host count item is basically doing a match using the Prometheus prefix and defined macro here:
with the triggers and graph prototypes using the same bits and pieces.
Which is basically it, over the four services we are checking. Which was quite a bit of clicking.
It could probably all be remade as a template and applied to multiple hosts if ever required, but having one host isn’t so bad as it keeps all the metrics together and you can search across them using the “Latest Data” link in the main GUI.
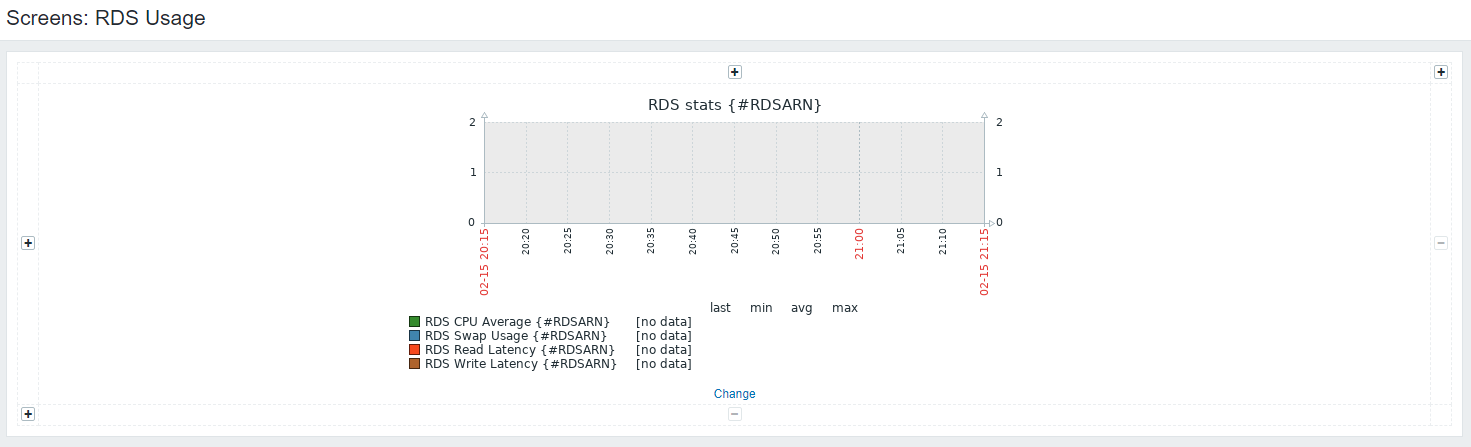
I’ve also made some ‘Screens’ in Zabbix for each service like this one for RDS, which shows all the instances and will add/remove them as they appear/disappear (after 24h of not being in the available metrics).
If you were wondering why we’re only collecting selected metrics, having all of them listed in the AWS documentation is a good place to understand that would be because each metric request has an API cost, and as such, calling every available metric in every available service across 27 accounts would cost about $20,000 / year…